
Applying Our Strategy Where It belongs: On Trending Markets
- Aug 17, 2016
- 6 min read
Good day, salutations and welcome once again, ladies and gentlemen, to the first of many exercise sets. In these you can expect to gain practical skill application experience as a FOREX trader. Here, I will be applying what I teach on the blogs and in class; as well as new material in terms of theory, additional angles and sharpening stones to this first strategy. This is where it all happens. Please, I ask you -if you have not already- to go through the lecture and the blog in a capacity of understanding. Make sure you get it, before attempting these exercises, otherwise this is fruitless. Come ready to learn and I promise that you’ll learn a whole lot.
Preface and Summary
So far we have learned the basic applicable criteria to take viable positions based on the Fib-Stoch Strategy (FSS); we have also learned about the individual mechanisms that make this strategy unique. BUT… We have had no real chance yet of applying any of this officially in the proverbial classroom. It is time we look at some real charts and to see if the strategy is good on real data.
More to know about getting maximum efficiency from this strategy
It will serve you well to always keep in mind that this is a TREND Trading Strategy (TTS); and what do we know about the trend? That it is our friend! Yes, our friend! Meaning that once a trend starts, it is VERY LIKELY to continue that course for a relevant amount of time (enough time for us to get in and make some profit). To take full advantage of this fact, we need to have a bit of a closer look as to how a trend usually behaves. There are only 3 broad ways in which the market can theoretically move:
Up, Down or Sideways/Consolidation (Bouncing up and down between a small range and goes neither up nor down).
We are going to focus on the Up and Down part. Now, here is the million dollar question: How do markets usually make their up and down trends? Another million dollars: How do we know which trends are strong enough to hit the profit target?
The answer to both is simple. A trend moves in two phases. Once again, BUT… some mathematically inclined people have even created a pretty accurate model of the markets which states that all movements are based on a 5-sequence repeat. These were called Elliot Waves. It was a huge deal as it actually was able to generate strategies which can be just as profitable as the one we are using now. The point is, that trends move in phases. The first phase is where the market moves strong enough in one direction -up or down- (look at the 200 EMA) to make a visible trend. The second phase, is the interesting part. This is where we come in. This second/retracement phase is there the market becomes complacent and decides whether it wants the current trend continues, or reversed (YES, markets can completely reverse their trend at any given time, but don’t worry, there is a plan for that too (patience is key). Just to be clear again: Trends have a running phase and a steady phase. We wait for the trend to break out of the steady phase (support/resistance levels) and there is where we strike with a trade. We will focus more on trade management later. Right now, we will focus just on spotting the right trades:
Enough of my written jabber :P It is time is show you a very real example of what I just explained above: Consider the following picture and text.

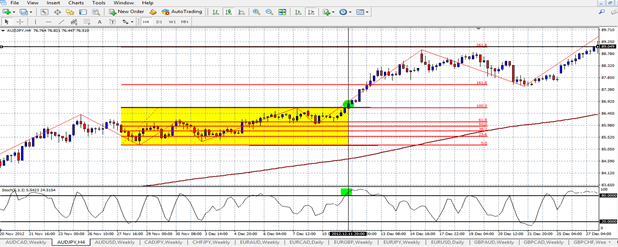
Figure 1: Shows The 4H Chart for the AUD/JPY pair between November and mid-December. One can clearly see that the market made an uptrend (first phase) where after reaching a certain point, tapered off and entered its second phase when it made a sideways consolidation, bouncing between the top resistance and lower support level. Finally, we see that the price broke the upper resistance WITH STOCHASTIC SUPPORT. Still with me?
This is definitely a valid trade setup. BUT, I know a lot of you already saying that the broken resistance level is not even strong and how does that give us a valid trade? The answer is the same reason why I had to include this extra theory. In the first lecture, I showed pictures of strong and weak supp/resis levels, these are clearly not too strong by the looks of them. The only catch here is the trend. The range of a consolidation MUST BE COUNTED AS VERY STRONG SUPP/RESIS LEVELS. Where the lines I showed previously come in, is when we look at where we thing the price is going to stop or reverse, etc. This will also be integrated into your analysis over time as you learn to read more variables on the chat (which is the direction of our next lectures and blog)
Looking at the picture above again, we see that this is indeed a valid setup based on our criteria:
Broken Resistance: Yes
Stochastic Support: Yes
Is the candle breaking out strong (NO UPPER SHADOW): YES
Trending Market: YES (According to 200 EMA) *keep in mind: The stronger the trend was before the sideways movement, the more likely a strong continuation will ensue.

Given that this is a valid setup, we go and add the Fibonacci retracement from top to bottom of the range so that that the 161.8 and 261.8 lines is to the direction of the breakout. See next figure.

We have now done all the grind-work (we will go into much more details on the finer aspects of trade management quite a bit later). Now its just a matter of following the market to see if our trade works out. Any arrival of the price near the 161.8 is a success, if the 261.8 is reached, it is the next level of success. This involves a specific method of entering trades and setting profit targets to maximize the winning potential, but once again, that is for later.
If we allow the market to run, we see that the price indeed reached the 161.8 with ease and if we look further, we can say the same for the 261.8. All in all, this
could be considered a textbook successful trade and I assure you, they pop up everywhere (relatively speaking).
This is also the perfect example for two more reasons. It shows a very well-documented kind of behavior using Fibonacci retracements: The 161.8 is more often than not RETESTED. This means that once the 161.8 is broken, the price is very likely to come back down towards it before it reaches the 261.8. We use this later to give the price enough room to do what it wants, without hitting the stop-loss prematurely. As I said, that comes later.
The second reason for this is that this trade, IF DONE RIGHT, would have yielded us a reward upwards of 10x the risk we took. In exciting terms: Even if we lose nine trades, and win only one, we make back all the loss and still have some profit. This will depend greatly on what will be taught in the next few weeks.
There are plenty more setups like this to find within the charts, some uptrends, some downtrends, some weak and some strong.
This is where YOU, not me, YOU come in. Your homework (No due date, but consider it necessary to do for your own welfare as a trader.
HOMEWORK:
I put it to you, to find at least 23 strong and valid setups (given the simple criteria) within the history of these charts (Look only at the 4H for this exercise).
Do this without seeing the future of the candlesticks before-hand (Select a pair, disable the little button at the top with a little green play on it, make sure the one next to it with the little red arrow on it is on, then grab the background with mouse and keep scrolling into the past of a pain until it cant take you further) Then slowly start scrolling right to find your setups)
Try to get one setup on each of these following pairs (Hence 23)
AUDCAD AUD/CHF AUDJPY AUDUSD CAD/CHF CADJPY CHFJPY EURAUD EURCAD EURGBP EURJPY EURUSD GBPAUD GBPCAD GBPCHF GBPJPY GBPUSD NZD/CHF NZDUSD USDCAD USDCHF USDJPY Gold
Incidentally, these are the only currency pairs I trust to trades as they have shown the most promise in the past.
WITH EACH TRADE YOU FIND, TAKE A PRINTSCREEN OF IT WITH ALL YOUR INDICATORS AND FIBANACCI RETRACEMENTS ON IT.
TAKE A: “BEFORE YOU SCROLL TO SEE IF IT WORKED” and ‘AFTER YOU SCROLL TO SEE IF IT WORKED” Picture so you can compare the two. In total you’re going to make a document with 46 pictures in it
Give a short description above the pics (WHICH PAIR IT IS FROM, THE TIME IN WHICH THE SETUP OCCURRED, DIRECTION OF TREND)
THAT IS ALL, FOLKS
Thank you all once again for sticking with me on this. Read this exercise not only once or twice, but also until you understand every part about it.
I would like any and all who FINISH this assignment to mail it to me so I can give feedback ASAP. DO NOT EMAIL ME UNINISHED WORK… PLEASE J
Email: janco.student@gmail.com I will add all who finish this to a mailing list which means you will get the new lectures, blogs and exercises DIRECTLY as I churn them out.
APPLY YOURSELVES!
And you will succeed…
You have all been beautiful and wonderful once again.
Yours ever educating and believing in each and every one of you,
LEX


Comments